
ICE Enforcement and Removal Operations Statistics has a tremendous amount of interactive material on their website, providing information. The site may be reached at ice.gov/statistics
The following data was taken on November 19, 2025 at 1:36 PM CST which indicated total removals of 616,657 for the five fiscal years beginning 2021 and ending with 2025. Of the 616, 657 illegal immigrants removed from the US during that five year period, 220,040 were convicted criminals.
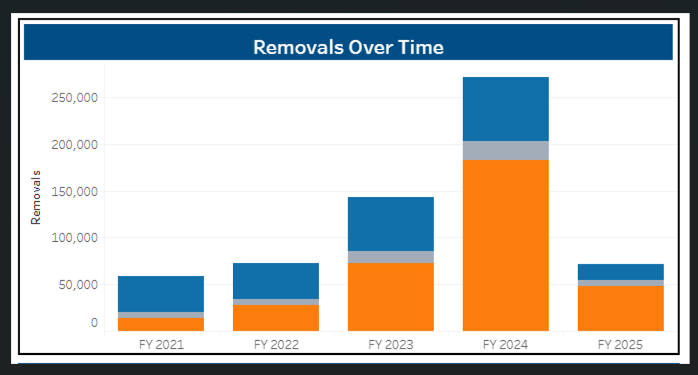
Of the total 220,040 removed, 22,654 were removed by the Trump administration, while 197,386 were removed during the four fiscal years of the Biden administration (based on ICE statistics). In order to see the actual numbers on the above ICE chart, tap the various components of the chart on your phone, tablet, or computer and the following will appear (the data won’t appear on the chart above, due to it being a screenshot.) Screenshots of the data as it appeared on the date and time listed earlier follows:


Remember a fiscal year begins on October 1st and ends on September 30th of the following year as follows:
| FISCAL YEAR | BEGINNING AND ENDING DATES | IA’S REMOVED WITH CRIMINAL CONVICTIONS | ADMINISTRATION |
| 2021 | 10-01-2020 – 09-30-2021 | 39,149 | Democrat Joseph R. Biden 75% = 29,361 |
| 2022 | 10-01-2021 – 09-30-2022 | 38,447 | Democrat Joseph R. Biden |
| 2023 | 10-01-2022 – 09-30-2023 | 57,021 | Democrat Joseph R. Biden |
| 2024 | 10-01-2023 – 09-30-2024 | 68,266 | Democrat Joseph R. Biden |
| 2025 | 10-01-2024 – 09-30-2025 | 17,157 | Republican Donald J. Trump 75% = 12,868 |
| TOTAL | 220,040 | Biden = 197,385 Trump = 22,655 |
In fiscal years 2021 and 2025 the Administration listed was only in power for three of the four fiscal quarters. Therefore, a minimum 25% of the illegals removed should be applied to the opposing party.
Politicians may exaggerate the truth on a regular basis, but as the old saying goes “the proof is in the pudding”.
(c) 2025 ArticlesandAnswers2011.wordpress.com


