
By Patricia Johnson
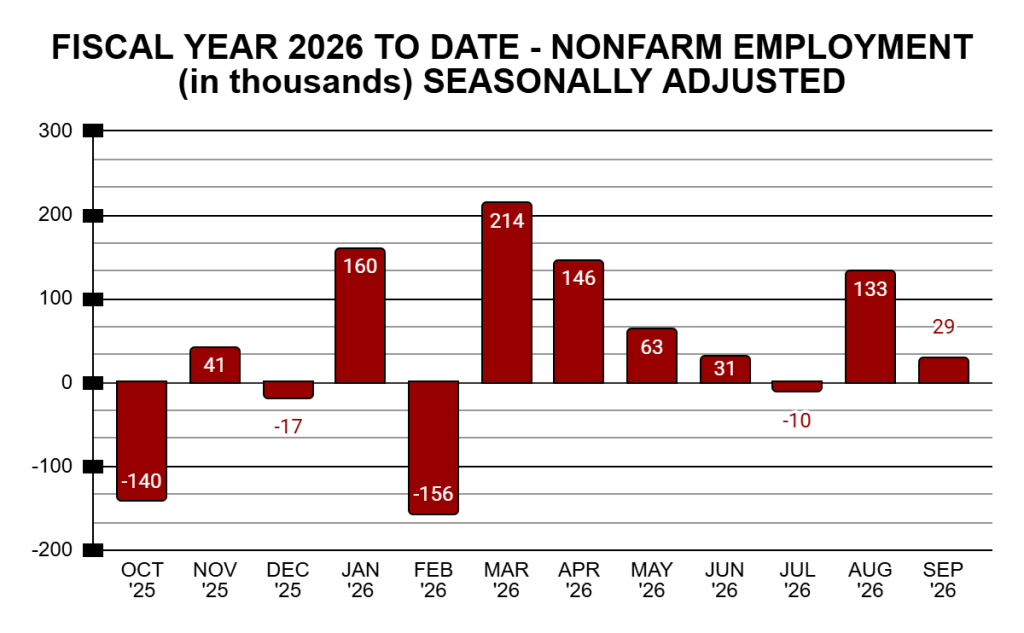
This morning the US BLS (Bureau of Labor Statistics) released the Employment Situation Summary for the fiscal month of September 2026.
With the addition of the September report, the total of jobs created in this country for fiscal year 2026 is 494,000. That’s an average of approximately 41,000 jobs created per month.
The 29,000 indicated for September 2026 is a preliminary number and as time goes by and additional information is obtained, there will be revisions to the number.
Unfortunately, the majority of revisions this year have been decreases rather than increases to the employment numbers.
© 2026 Patricia L Johnson


Excuse me?
The LIES you are referencing come directly from the Bureau of Labor Statistics, published under the Administration of Donald J. Trump. If you have a problem with the published numbers, I suggest you take it up with the members responsible for the pitiful employment numbers; and/or vote for qualified individuals.
BTW – if you really knew what you were talking about you would be able to make an argument based on actual numbers, vs. bad language 🙂
From the desk of the Administrator of Articles and Answers 2011.
FUCK YOU COMMIE MOTHERFUCKER, DO NOT SEND ME YOUR LIES !